During an ODA X7-2S upgrade from 19.9 to 19.13 we encountered the following issue. The prepatch report mentioned that the check “Validate kernel log level” failed with the message
OS kernel log level is set to debug, this may result in a failure when patching Clusterware If kernel OS log level is more than KERN_ERR(3) then GI patching may fail
This problem also seems to exist in versions 19.10+ . It is a problem that can not be ignored. Trying to update the server anyways will lead to an error.
Here is an example how such a prepatch report might look like
Patch pre-check report
------------------------------------------------------------------------
                 Job ID:  d94c910d-5ed5-4b02-9c65-9e525c176817
            Description:  Patch pre-checks for [OS, ILOM, GI, ORACHKSERVER]
                 Status:  FAILED
                Created:  March 14, 2023 11:52:10 AM CET
                 Result:  One or more pre-checks failed for [GI]


Node Name
---------------
ODA01

Pre-Check                      Status   Comments
------------------------------ -------- --------------------------------------
__OS__
Validate supported versions     Success   Validated minimum supported versions.
Validate patching tag           Success   Validated patching tag: 19.13.0.0.0.
Is patch location available     Success   Patch location is available.
Verify OS patch                 Success   Verified OS patch
Validate command execution      Success   Validated command execution

__ILOM__
Validate supported versions     Success   Validated minimum supported versions.
Validate patching tag           Success   Validated patching tag: 19.13.0.0.0.
Is patch location available     Success   Patch location is available.
Checking Ilom patch Version     Success   Successfully verified the versions
Patch location validation       Success   Successfully validated location
Validate command execution      Success   Validated command execution

__GI__
Validate GI metadata            Success   Successfully validated GI metadata
Validate supported GI versions  Success   Validated minimum supported versions.
Validate available space        Success   Validated free space under /u01
Is clusterware running          Success   Clusterware is running
Validate patching tag           Success   Validated patching tag: 19.13.0.0.0.
Is system provisioned           Success   Verified system is provisioned
Validate ASM in online          Success   ASM is online
Validate kernel log level       Failed    OS kernel log level is set to debug,
                                          this may result in a failure when
                                          patching Clusterware If kernel OS log
                                          level is more than KERN_ERR(3) then
                                          GI patching may fail

Validate minimum agent version  Success   GI patching enabled in current
                                          DCSAGENT version
Validate Central Inventory      Success   oraInventory validation passed
Validate patching locks         Success   Validated patching locks
Validate clones location exist  Success   Validated clones location
Validate DB start dependencies  Success   DBs START dependency check passed
Validate DB stop dependencies   Success   DBs STOP dependency check passed
Evaluate GI patching            Success   Successfully validated GI patching
Validate command execution      Success   Validated command execution

__ORACHK__
Running orachk                  Success   Successfully ran Orachk
Validate command execution      Success   Validated command execution
You can check the setting of the kernel log level like this
[root@ODA01 ~]# cat /proc/sys/kernel/printk
10 4 1 7
The first entry “10” means the loglevel is set to debug. It should be set to “3” (=error).
However changing the /proc/sys/kernel/printk file is not the correct way to solve the issue.
One must edit the file /etc/default/gruband to remove the “debug” entry there.
Then run
grub2-mkconfig -o /boot/efi/EFI/redhat/grub.cfg
Grub is the “grand unified bootloader” that activates when the ODA ( or a VM ) is started. The above command takes the default config and applies it to all relevant vm configurations.
On some ODAs (I believe older ODA X6-2) you might need to apply the change to a different configuration file. On our ODA X7-2S this file was not existent so we did not change it.
grub2-mkconfig -o /boot/grub2/grub.cfg
After this the server needs to be restarted, so that the new setting is applied.
The installation and configuration of ORDS has been changed quite a bit in version 22. Your hitherto existing installation and upgrade process needs to be carefully examined and probably reworked.
Here is an issue I encountered.
Imagine a database with two PDBs. One of them is the normal APEX database (test environment), the other is a regular pdb clone from a different environment, for example from development.
The goal is to run and access a different version of ORDS (and potentially APEX) in each PDB. This post considers only ORDS, not APEX.
For simplicity we want to access the first environment using “ords” in the url and the second one using “clone”.
In older ORDS versions, it was possible to:
configure ORDS in standalone mode,
rename the war file and
copy it into the webapps folder in tomcat.
And doing the same for the second database we could easily setup two independent versions of ords on a single tomcat.
This process does not function anymore, because the path to the configuration is not added to the ords.war file as it was previously.
Architecture overview
Solution
The following solution assumes that you already upgraded ords, including the ords meta data repository in both databases to the new version. If you don’t have that, look at the prerequisites section and the links near the end of this article.
To run two ords in standalone mode is fairly easy. Use a different port and a different --config parameter while starting ORDS (and possibly starting different versions of ORDS).
It is different for a single tomcat server whichs runs both ORDS using the same port but a different url base path.
We can configure a single ORDS to connect against multiple databases. However this means that the ords version is always the same. The goal is to run a different version of ORDS – so that ORDS matches the metadata repository in the PDB – and to use a slightly different base path. Both do not work when using the same ORDS with the same configuration.
Fortunatly we can recreate the pre 22.x behaviour by creating a new war file.
There is a documented way to create a war file similar to what we were used to. By using the ords war command we are able to inject the setting for the configuration path into a (new) war file. This setting eventually ends up in the web.xml of the tomcat deployment as we will show.
tomcat deployment
Setting the config.url parameter is possible during tomcat startup.
But doing it this way would not allow us to have two ords using a different configuration folder.
export JAVA_OPTS="-Dconfig.url=${ORDS_CONFIG}"
The alternative is to set the config.url parameter inside the web.xml file in each webapp.
We could do that manually but fortunatly oracle gives us a command to create a war file. Using it we can take this war file, put it into the webapps folder on tomcat, and the necessary web.xml file will be created.
war file creation
Warning: the following command will immediately overwrite an existing war file on tomcat in the webapps folder. If you don’t want that then go to a different target folder.
configure ords for PDB1
export PATH=/opt/sven/tst/ords/ords-22.4.0/bin:$PATH
export JAVA_HOME=/usr/java/jdk-17.0.6
cd /opt/sven/tst/tomcat/latest/webapps
ORDS_CONFIG=/opt/sven/tst/ords/ordsconfig/ords
URL_BASE_PATH=ordsords --config ${ORDS_CONFIG} war ${URL_BASE_PATH}.war
The variables are only created for easy usage and so that they can be easily adapted for the second database.
configure clone for PDB2
export PATH=/opt/sven/tst/ords/ords-22.4.0/bin:$PATH
export JAVA_HOME=/usr/java/jdk-17.0.6
cd /opt/sven/tst/tomcat/latest/webapps
ORDS_CONFIG=/opt/sven/tst/ords/ordsconfig/clone
URL_BASE_PATH=cloneords --config ${ORDS_CONFIG} war ${URL_BASE_PATH}.war
result: check tomcat deployments
As soon as a new war file is put into the webapps folder, the subdirectories are created. This behaviour depends on the tomcat configuration, but it is the default. So no need to restart tomcat to see the unzipped war files. We can check the result in the webapps/ords/ and webapps/clone/ folders.
The described solution assumes that you already upgraded ords, including the ords meta data repository in both databases to the new version.
The installation / migration requires to supply the old configuration folder, the new configuration folder and the database connect.
java version
ORDS 22 requires java 11 or 17. We decided to upgrade to java 17 (which is free again). I did not test if it is possible to run different java versions for each ORDS on the same TomCat. This might be a problem in the future, if the minimum java version for ORDS is increased again.
… The Oracle JDK is free to use for any Oracle product requiring Java, which includes ORDS. That same Java can’t then be used for a non-Oracle product, that could trigger licensing issues. Of course with Java 17, Oracle Java becomes free again. …
If you want to automate the installation and deployment process, below is a link to a blog post by Peter O’Brian that gives some more details about web deployments. It features a python script that is able to create a new .war file that includes the needed config path setting. It might be worth looking at, especially if you want to add more configurable options for automatic deployments.
alternative architecture
If you want to access multiple databases using the same ORDS then consider the following architecture. You will need a single configuration folder with multiple databases (pool configs) in it. I will not go into further details here, because that was not the goal of this post. But if you are interested in how to set it up, then add a comment and I might consider writing an extra post about it.
In recent times I speculate where and when to use scalable sequences. Especially if it makes sense to use them in general for sequence driven ID columns of larger tables. I know this sounds a bit like an early sign of CTD (compulsive tuning disorder), but at least I’m aware of it.
Scalable sequences offer a performance benefit in certain special situations (hot block, index contention). This post is not about those benefits.
I assume the reader has a basic understanding what a scalable sequence is. If not, check out this older post of mine: All about sequences .
A scalable sequence provides larger numeric values than a normal sequence does.
A normal sequence => 3 A scalable sequence => 10176700000003
Here I only analyze and test the effects of those bigger numbers, especially for indexes.
Side note: The first 3 digits of the scalable sequence are the instance number + 100. The second 3 digits are the session id. The remainder is the normal sequence value. Different sessions provide different numbers and by this the sequence numbers are not monotonously increasing anymore. At least not when looking at multiple sessions. Which also means inserts are done all over the index and not only on the right hand side of the index.
Bigger numbers need more storage
The number 3 needs 2 bytes, the number 10176700000003 needs 8 bytes of storage. Use the DUMP function to measure it. Values provided by scalable sequences might use up to 18 bytes of storage.
This effects multiple areas, table segment size but also indexes tend to be bigger. We can safely assume the sequences are used to provide values for ID columns which are almost always supported by an unique index. But there are also foreign key columns using those numbers and there the index will not be unique for similar ID values.
Because values are bigger less index references fit into a single index block – meaning we need more index blocks. Here I focus explictly on the size of indexes and not on the size of columns. I believe that a few additional bytes for a whole table row is usually not relevant. In case of an index however the whole row is that single value plus references (index branch block) or rowids (index leaf block).
For comparison reasons I also check the size of an reverse key index since they were used in the past to combat index contention issues. Scalable sequences are the new kid in town that should replace reverse key indexes.
So let’s measure it.
Testscript 1 – single session insert
First we create a table with 3 number columns. Then we create a normal and a scalable sequence that provide some values. We add two normal and a reverse key index on those 3 columns and populate the table with values originating from the sequences.
------------------------------------------------------------------------------- Scenario: Test index size
--------------------------------------------------------------------------------
-- create a table with two columns files with IDs
create table test_sequence_effects
  (id_normal number,
   id_scalable number,
   id_reverse number);

-- create a normal and a scalable sequence
create sequence test_sequence_normal;
create sequence test_sequence_scale scale;

-- create 3 indexes
create index test_sequence_normal_ix on test_sequence_effects(id_normal);
create index test_sequence_scale_ix on test_sequence_effects(id_scalable);
create index test_sequence_reverse_ix on test_sequence_effects(id_reverse) reverse ;

-- insert 1 million datapoints
insert into test_sequence_effects
select test_sequence_normal.nextval, test_sequence_scale.nextval, test_sequence_normal.nextval
from dual connect by level <= 1000000;

commit;

-- create statistics
execute dbms_stats.gather_index_stats(user, 'TEST_SEQUENCE_NORMAL_IX',estimate_percent => 100);
execute dbms_stats.gather_index_stats(user, 'TEST_SEQUENCE_SCALE_IX',estimate_percent => 100);
execute dbms_stats.gather_index_stats(user, 'TEST_SEQUENCE_REVERSE_IX',estimate_percent => 100);
result after single session insert
We can have a look at the index statistics and the segment sizes.
-- check index stats
select index_name, blevel, leaf_blocks, distinct_keys, clustering_factor
from dba_indexes
where index_name like 'TEST_SEQUENCE_%';
INDEX_NAME
BLEVEL
LEAF_BLOCKS
DISTINCT_KEYS
CLUSTERING_FACTOR
TEST_SEQUENCE_NORMAL_IX
2
1999
1000000
4271
TEST_SEQUENCE_SCALE_IX
2
3379
1000000
4271
TEST_SEQUENCE_REVERSE_IX
2
2965
1000000
999996
Now all three indexes still have the same blevel, meaning for a single direct index access the performance should be identical. However when the number of entries increases eventually the ID values created by a scalable sequence might create a new level in the btree before the same happens for IDs from a normal sequence. I tested when this will happen. If you are curious check out the appendix section “blevel3 break point”, but try to guess the value before you check.
-- check index size
select segment_name, segment_type, segment_subtype, blocks, bytes/1024/1024 as size_in_MB
from user_segments
where segment_name like 'TEST_SEQUENCE_%';
SEGMENT_NAME
SEGMENT_TYPE
SEGMENT_SUBTYPE
BLOCKS
SIZE_IN_MB
TEST_SEQUENCE_EFFECTS
TABLE
ASSM
4352
34
TEST_SEQUENCE_NORMAL_IX
INDEX
ASSM
2176
17
TEST_SEQUENCE_REVERSE_IX
INDEX
ASSM
3072
24
TEST_SEQUENCE_SCALE_IX
INDEX
ASSM
3584
28
table and index size
The scaleable index in this experiment is 65% larger than the normal index. The cause for this increment can be attributed directly to the bigger numbers that needs to be stored.
We have to keep in mind that the test scenario was run in a single session. In reality multiple sessions will be used to run the insert(s). This is where scalable sequences should give a performance boost, even at the cost of potentially slightly higher storage consumption.
Testscript 2 – parallel inserts from multiple sessions
Ok now repeat the same experiment but using multiple sessions instead of a single session.
I created a code block that repeatetly does single row inserts in blocks of 10 and waits 1 second. This was run in up to 100 parallel sessions using dbms_scheduler jobs until approximately 1 million rows were inserted. The code for this test can be found in the appendix section “Testscript 2 – code”. Because of the 1 sec. pause this will run for some time.
Index stats after parallel inserts
INDEX_NAME
BLEVEL
LEAF_BLOCKS
DISTINCT_KEYS
CLUSTERING_FACTOR
TEST_SEQUENCE_NORMAL_IX
2
3649
1000198
943211
TEST_SEQUENCE_SCALE_IX
2
6577
1000198
32329
TEST_SEQUENCE_REVERSE_IX
2
3240
1000198
986633
The number of blocks increased for all indexes. But more importantly we see that the clustering factor for the normal index went through the roof and is now close to the number of rows in the table. Which is bad. It also shows that scalable sequences seem to keep the promise of avoiding index contention and hot blocks, even if this test was not set up to measure any performance implications.
If you want to know more about clustering factor, read appendix section “index clustering factor”.
Side note: There were a few more rows inserted than in the single session approach (0.02%). That was because how the stopping mechanism worked for the parallel jobs. It does not influence the comparison at all.
Index sizes after parallel inserts
SEGMENT_NAME
SEGMENT_TYPE
SEGMENT_SUBTYPE
BLOCKS
SIZE_IN_MB
TEST_SEQUENCE_EFFECTS
TABLE
ASSM
4480
35
TEST_SEQUENCE_NORMAL_IX
INDEX
ASSM
3840
30
TEST_SEQUENCE_REVERSE_IX
INDEX
ASSM
3328
26
TEST_SEQUENCE_SCALE_IX
INDEX
ASSM
6784
53
So the size of a normal index rose from 17 to 30MB (76% increase) and for the scaleable index from 28 to 53MB (83%). The reason for both increaments in size should be because now we see more 50-50 index block splits resulting in a considerable amount of blocks not being full and rarely being reused.
Overall the size didn’t explode, but it is still a noticable amount.
Side note: It is possible to shrink the indexes after such parallel insert sessions, but the effect is not great. Shrink and coalesce really should be considered when frequent deletes are run against the table. Scalable sequences potentially can provide values that might fill some of the gaps created by deletes. An index rebuild is not needed or advisable as long as more inserts are to come.
Conclusion
Values created by scalable sequences are using more storage space than values from normal sequences. For indexes we can expect a growth in index size between 50% and 100% compared to a normal index. The growth is partially because of larger numbers but also because there will be more not yet used space in many of the index blocks (caused by 50-50 index block splits instead of 90-10).
The clustering factor for scalable sequences always is better or equal than any alternative.
For all customers that I work with such an increment in storage size would not be any problem at all, especially if there is a performance improvement.
For me the storage size increase is not an argument against scalable sequences.
Appendix
Testscript 2 – code
--------------------------------------------------------------------------------
-- Scenario: Test index size after parallel inserts
--------------------------------------------------------------------------------
-- cleanup logic
drop table test_sequence_effects purge;
drop sequence test_sequence_normal;
drop sequence test_sequence_scale;

execute dbms_scheduler.drop_program('test_sequence_do_inserts');
begin
 for j in (select job_name from all_scheduler_jobs where job_name like 'TEST_SEQUENCE%') loop
     dbms_scheduler.drop_job(j.job_name);
 end loop;
end;
/
--------------------------------------------------------------------------------
-- create a table with three columns to be filled with IDs
create table test_sequence_effects
  (id_normal number,
   id_scalable number,
   id_reverse number);

-- create a normal and a scalable sequence
create sequence test_sequence_normal;
create sequence test_sequence_scale scale;

-- create 3 indexes
create index test_sequence_normal_ix on test_sequence_effects(id_normal);
create index test_sequence_scale_ix on test_sequence_effects(id_scalable);
create index test_sequence_reverse_ix on test_sequence_effects(id_reverse) reverse ;

-- insert 1 million datapoints
-- run as 100 parallel scheduled jobs
-- each job inserts a batch of 10 IDs using single row inserts
-- each job waits for 10 seconds before the next batch is run
-- each job stops after the max number for the normal ID is reached.

--create a program for dbms_scheduler to be used in jobs later
begin
    DBMS_SCHEDULER.create_program (
    program_name   => 'test_sequence_do_inserts',
    program_type   => 'PLSQL_BLOCK',
    program_action => q'[declare
  last_id number;
  max_id number := 1000000;
  cnt_id number := 0;
  e_stop exception;
  pragma exception_init (e_Stop, -20022);
begin
  for j in 1..max_id/10 loop
    -- single insert for 10 rows
    for i in 1..10 loop
        insert into test_sequence_effects
        values (test_sequence_normal.nextval -- ID_NORMAL
             , test_sequence_scale.nextval  -- ID_SCALABLE
             , test_sequence_normal.nextval -- ID_REVERSE
             )
        returning id_normal into last_id;
        cnt_id := cnt_id + 1;
        if last_id >= max_id then
          commit;
          raise e_stop;
        end if;
    end loop;
    commit;
    -- pause for 1 sec
    dbms_session.sleep(1);
  end loop;
exception
 when e_stop then
   -- finish gracefully
   dbms_output.put_line('This session inserted '||to_char(cnt_id)||' rows');
   commit;
end;
]',
    enabled        => TRUE,
    comments       => 'Insert 10 rows, 1 sec pause.');


   -- activate the program. This does not run the logic yet.
   DBMS_SCHEDULER.enable (name => 'test_sequence_do_inserts');

end;
/

-- create multiple jobs
begin
  for j in 1..100 loop
     dbms_scheduler.create_job
     (job_name      => 'test_sequence_do_inserts_job'||to_char(j,'FM000'),
      program_name  => 'test_sequence_do_inserts',
      start_date => systimestamp,
      enabled => true);

     dbms_scheduler.run_job (job_name => 'test_sequence_do_inserts_job'||to_char(j,'FM000'),
                              use_current_session => false);
   end loop;
end;
/
After executing this script the scheduled job runs for quite some time.
We can check the number of rows in the table to see if it is finished.
select max(id_normal) last_value,count(*) row_count from test_sequence_effects;
other interesting selects to monitor the scheduled jobs
-- check scheduler jobs
select * from all_scheduler_programs;
select * from all_scheduler_jobs where job_name like 'TEST_SEQUENCE%';
select * from all_scheduler_running_jobs where job_name like 'TEST_SEQUENCE%';
select * from all_scheduler_job_log where job_name like 'TEST_SEQUENCE%';
select * from all_scheduler_job_run_details where job_name like 'TEST_SEQUENCE%';
What is the clustering factor of an index? Essentially it tells us how good the index and the table data match. How many table blocks need to be read if each block is accessed via the index? The value itself needs to be compared with the number of blocks (min value) and rows (max value) in the table.
Here are some links that might improve your understanding of the clustering factor:
For multiple sessions the same amount of blocks/leaf blocks should be reached earlier. However the distribution would be considerably more even. Both effects will partially cancel each other out. So far I didn’t measure it.
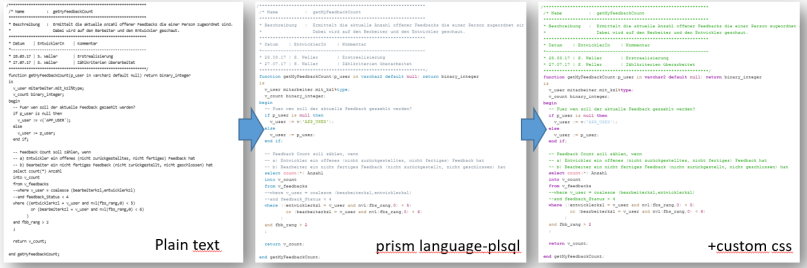
To show (not to edit) pretty code inside an APEX application in the past I had used the libraries that were deployed along with APEX, like CodeMirror (see https://svenweller.wordpress.com/2015/12/07/apex-5-syntax-highlighting/) and CkEditor. In APEX 21 CkEditor got a new version and CodeMirror is not supplied anymore since several APEX versions now. But there is a new very lightweight alternative, which is prism.
In my use case I need this to quickly present currently running edition based plsql code.
Implementation
Step 1) Load code into a hidden page item
I use a before region process to load the data (=code) into an item. Assuming item name P1_CODE for further references.
Step 2) Add prism files to the page
Javascript file urls
#PRISMJS_DIRECTORY#prism.js
CSS file urls
#PRISMJS_DIRECTORY#prism.css
Note that the substitution variable PRISMJS_DIRECTORY is automatically provided and resolved to the path “/i/libraries/prismjs/1.24.1/” and is updated in future versions.
Step 3) Show item in html region and choose the language
Add this to the html code section of a static region.
Note that you should set the correct language that you want to show. In my case it is language-plsql.
The value in the item is automatically html escaped. In case the logic that loads the code into the item did already escape it, you can also choose not to escape it again, by using an escape filter like &P1_CODE!RAW. . Just be aware of potential security issues, if you do not do that correctly.
A list of possible languages can be found here. However not all of those languages are added in the APEX deployment.
Step 4) Customize a few colors
I didn’t like the coloring for plsql or sql code. Especially I prefer to show comments in green. This can be changed with a few lines of css.
If you want different settings, simply inspect the code snippet using the browser. That is one of the advantages of prism. The code is tokenized using span tags and the appropriate classes. We can easily see what kind of token a certain element is and simply change the style for the class we want.
Result
Here is a crude overview how the result looks like
Additional considerations
prism has the possibility to add many additional features. However those features come as plugins that are packed directly into the .css and .js files. To use them, one would have to add/replace the library that is used by APEX. I didn’t investigate in detail, which plugins are already inclued. For example line numbering does NOT seem to work out of the box.
This would do the trick with the line numbers, if the line-numbers plugin is integrated.
For simple requirements prism allows a very easy and quick way to add syntax highlighting to code. For more complex requirements (like editing code) a different library might be better suited. The possibility to have dedicated subtitution strings for several libraries is very welcome.
One additional note. I tried to use the markdown editor item type as an alternative, but the effort to make it work for my simple requirements, was too high. A markdown editor simply serves a different purpose.
This is something I read about and forgot until Chris Saxon mentioned and showcased it during todays AskTOM Office Hour session.
In Oracle 12.2 the create table command was enhanced to avoid the error
ORA-14097: column type or size mismatch in ALTER TABLE EXCHANGE PARTITION
during an exchange partition operation. We can now do create table ... for exchange.
The basic idea is that the for exchange syntax enhancement considers things like invisible columns that are usually not created and by that it avoids complications during an exchange partition at a later time. For further details see this blog post by Connor McDonald.
Here I show a situation, where the ORA-14097 still happens, even if the for exchange syntax is used. Just something to be aware of and watch out for.
demo
First we create two identical partitioned tables, the source table A and the destination table B.
-- create the source table using NULLABLE columns
create table a (col1 number null, col2 number null, col3 number null)
PARTITION BY range (col1) interval (1)
  (PARTITION old_data VALUES LESS THAN (0)
  );
;
-- add a primary key constraint
alter table a add primary key (col1, col2);
desc a;

Name Null?    Typ
---- -------- ------
COL1 NOT NULL NUMBER
COL2 NOT NULL NUMBER
COL3          NUMBER
As you can see the table looks as if col1 and col2 are not null. This is because the primary key requires all columns to be not null.
Now we do exactly the same for table B. in my real world case scenarion table A was on a remote database and table B was a local one, created by a tablespace transport. So source and destination are identical.
create table b (col1 number null, col2 number null, col3 number null)
PARTITION BY range (col1) interval (1)
  (PARTITION old_data VALUES LESS THAN (0)
  );
;

alter table b add primary key (col1, col2);
Now we fill the source table A with some dummy data.
-- add some data into a
insert into a (col1, col2, col3)
select mod(level,10) ,level, mod(level,100) from dual connect by level <= 1000;

1000 rows inserted.

commit;

Commit finished.
Next step is to create and fill a staging table e which will hold the partition that we want to add to B. Notice that during the create table command the FOR EXCHANGE syntax is used. Unfortunatly it seems we can not do a CTAS when using the syntax enhancement, so two commands are used: create + insert.
create table e for exchange with table b;
insert into e select * from a partition for (9);
Side note: Because the table is interval partitioned, here “partition for” is useful to specify the source partition.
desc e;

Name Null? Typ
---- ----- ------
COL1       NUMBER
COL2       NUMBER
COL3       NUMBER
The exchange table e is declared with NULL columns. Although this reflects the original table without the PK, it will lead to a problem during the exchange.
alter table b exchange partition for (9) with table e;
ORA-14097: column type or size mismatch in ALTER TABLE EXCHANGE PARTITION
*Cause:    The corresponding columns in the tables specified in the
           ALTER TABLE EXCHANGE PARTITION are of different type or size
*Action:   Ensure that the two tables have the same number of columns
           with the same type and size.
This error will not happen if we do the same commands, but without adding the primary key constraint.
Conclusion
Even when using for exchange, you can still run into the “mismatched columns” problem (ORA-14097). In this particular example the problem is, that the addition of the primary key converts the key columns to NOT NULL. But this conversion is not reflected in the CREATE TABLE .. FOR EXCHANGE command.
Btw: The error can be avoided by creating the columns with NOT NULL in the first place.
-- enable sql*plus to track the name of any currently running script as module name in application_info
set appinfo on

-- define sql*plus substitution variables SCRIPTNAME and LOGFILENAME
column script_name new_value scriptname
column logfile_name new_value logfilename

-- fetch name of the currently running SQL*plus script
select regexp_replace(sys_context('userenv','module'),'^\d*@ *') as script_name from dual;

-- change suffix from .sql to .log and use as name for the log
select replace('&scriptname.','.sql$','.log') as logfile_name from dual;

-- start the log
spool &logfilename.
Purpose
Typical for an sql*plus script is that we spool the output to another file. Sometimes to export data and even more often to capture what happend in case of an error. The latter case is a typical example where the presented code will help to reduce hard coding the name of the script file into the file itself. So if the script name changes we don’t need to remember to change the hardcoded values inside the script.
Problem demonstration
$ sqlplus /nolog @myScript.sql
connect myUser/myPwd@myTnsAlias

spool myScript.log;

declare
  v_script varchar2(128);
begin
  v_script := 'myScript.sql';
  doSomething;
exception
   when others then
     logger.log_error ('Error in Script '||v_script);
     raise;
end;
/

spool off;
The example shows that the name of the script “myScript” is hardcoded two times inside the script itself.
So whenever the name of the script changes, there is a good chance we need to change those two hardcoded occurences too. This includes cases where we copy this script as the basis for another script,
Here is how we can avoid the hard coding.
Solution
$ sqlplus /nolog @myScript.sql

-- enable sql*plus to track the name of any currently running script as module name in application_info
set appinfo on

-- define sql*plus substitution variables SCRIPTNAME and LOGFILENAME
column script_name new_value scriptname
column logfile_name new_value logfilename

-- fetch name of the currently running SQL*plus script
select regexp_replace(sys_context('userenv','module'),'^\d*@ *') as script_name from dual;

-- change suffix from .sql to .log and use as log name
select replace('&scriptname.','.sql$','.log') as logfile_name from dual;

-- start logging
spool &logfilename.

declare
  v_script varchar2(128);
begin
  -- move sql*plus substitution variable into plsql variable
  v_script := '&scriptname.';
  doSomething;
exception
   when others then
     -- add name of currently running script to the error log
     logger.log_error ('Error in Script '||v_script);
     raise;
end;
/
spool off;
Detailed code explanation
Some words what exactly is happening in the script.
Step 1) enable appinfo
First we need to enable SQL*plus to track the name of any script that is running as the module name in the application information of the session.
-- enable sql*plus to track the name of any currently running script
-- as module name in application_info
set appinfo on
There are several ways to retrieve this information. We can see it in v$session or v$sqlarea, we can use dbms_application_info.read_module or we can check the userenv context module .
Step 2) define sql*plus variables
The name of the script should be stored in a sql*plus substituition variable scriptname which is not a bind variable.
Typically a substitution variable is created using the DEFINE command. But here we use the lesser known way of matching a column name from a select to such a variable. column <column> new_value <variable>
To use such a variable the syntax is “&variable.” (without the “). The value of a substitution variable replaces (substitutes) the name of the variable anywhere inside the script. Ambersand “&” marks always the beginning and dot “.” can mark the end of the variable name, but the dot is optional. If a normal character (or even a dot) follows the substitution, then the additional dot is important to specify, where the name of the substition variable ends.
Because it is a sql*plus variable, this can replace values inside of strings.
Step 3) get the script name
Assumption is that a script was started, either by calling start scriptname (or short @scriptname) or by providing the name of the script when calling sqlplus from the shell. Both ways work.
We read the name of the script from the userenv: sys_context('userenv','module')
The value that is delivered seems to have some additional stuff at the beginning. This is something you should check in your system, how the file name exactly looks like. In my case it was the string “01@ myScript.sql“
Some string manipulation is needed to get rid of the first part “01@ ” of the returned string. I used a regular expression to do so. Choose whatever you prefer.
-- fetch name of the currently running SQL*plus script
select regexp_replace(sys_context('userenv','module'),'^\d*@ *') as script_name from dual;
The regexp replace command removes any number of digits “\d*” followed by “@” followed by a blank ” ” from the beginning “^” of the string and keeps the remainder intact.
Step 4) Get the logfilename from the scriptname and spool the log
Remember because of the column mapping earlier, the column logfile_name provides the value for our substitution variable logfilename.
'&scriptname.' is resolved at runtime into 'myScript.sql'.
Assuming that the script has a suffix .sql (default), we replace that suffix with .log.
-- change suffix to .log and use as log name
select replace('&scriptname.','.sql','.log') as logfile_name from dual;

-- start the log
spool &logfilename.
Recommendation is to use a plsql variable and put the SQL*plus substitution variable into the plsql variable. Then use this plsql variable wherever you need it, including the error handler. In general this should only be done for code directly inside your script, not inside some plsql packaged procedure for example. Reason is, that there is no guarantee, that the sql*plus variable is set during all executions of the packaged procedure.
criticism
A working connection to the database is needed. So the log does not store every command that runs inside the script. Especially it can not include any potential connect commands nor the commands to find out about the name of the script.
We can not generalize this code (step 3) into another script, because there the script name would be different.
Because substitution variables need the ambersand “&” it is not easy to make sql*plus avoid interpreting ambersands that are part of normal strings as the beginning of a substitution variable. Or to say it in another way. Careful with set define off. A workaround sometimes can be to set define off at a later time in the script, when our variables are not used anymore or even to move the value from a substitution to a bind variable.
Here is a quick overview about commands in SQL*plus that help to track and measure time.
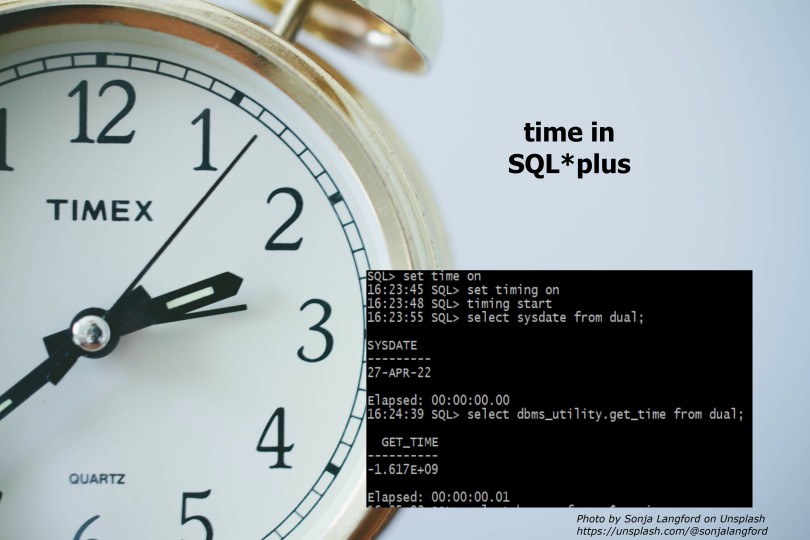
set time on/off
This displays a prompt in front of each statement with the current time. Be aware that it is not the time, when the statement was executed, but the time when the line in sql*plus was created. This difference is usually not relevant when running scripts, just something to be aware of when manually typing and executing statements in sql*plus.
SQL> set time on;
10:56:02 SQL>
10:56:10 SQL> execute dbms_session.sleep(3);

PL/SQL procedure successfully completed.

10:56:23 SQL>
The prompt shows that 13 seconds passed by. However the sleep time specified was only 3 seconds. The reason is it took me approximately 10 seconds to type the statement.
set timing on/off
The result is the runtime of a sql statement or an anonymous plsql block in SQL*plus.
After any SQL statement or anonymous plsql blocks, sql*plus shows the elapsed time for that command.
The elapsed time is not shown after SQL*PLUS commands (like SET or SPOOL).
The time is measured on the client. So it includes the time to send the command to the server, execute the command there and move the resulting information from the database server back to the sql*plus client. When very exact measurements are needed network issues will make this elapsed time fluctuate a little more than what is useful.
timing start+stop
Timing start+stop is very similar to set timing on/off. It starts a timer with timing start and shows the elpased time after the timing stop command. This allows to measure the time to run multiple commands. Wheras set timing on/off only measures a single command.
SQL> set time on;
11:14:37 SQL> timing start
11:14:45 SQL> execute dbms_session.sleep(3);
PL/SQL procedure successfully completed.
11:14:55 SQL> select * from dual;
D
-
X
11:15:00 SQL> execute dbms_session.sleep(1);
PL/SQL procedure successfully completed.
11:15:12 SQL> timing stop;Elapsed: 00:00:31.48
11:15:17 SQL>
We can compare the measurement from timing with the times shown by set time on. From 11:14:45 to 11:15:17 there are 32 seconds. Which matches perfectly the elapsed time or 31.48 seconds shown by timing start+stop.
_DATE
This is a predefined sql*plus variable that holds the current time. It uses the sessions nls settings as display format.
SQL> prompt &_DATE27-APR-22
SQL> alter session set nls_date_format = 'dd-mm-yyyy HH24:MI:SS';
Session altered.
SQL> prompt &_DATE27-04-2022 11:22:20
SQL> set pagesize 10
SQL> ttitle "Important list of numbers &_DATE."
SQL> select level as num from dual connect by level <= 10;
Important list of numbers 27-04-2022 11:59:56
NUM
----------
1
2
3
4
5
6
Important list of numbers 27-04-2022 11:59:56
NUM
----------
7
8
9
10
10 rows selected.
SQL> ttitle OFF
Useful when one wants to add the day and/or time to the name of a log file for example.
sysdate/systimestamp
These are SQL pseudofunctions that give the current datetime. Sysdate delivers a date (incl. time up to the second), systimestamp delivers also fractional seconds. The time is derived from the servers time settings. So client settings do not influence the value. However client nls settings effect the conversion to strings.
SQL> select sysdate from dual;

SYSDATE
---------
27-APR-22

SQL> alter session set nls_date_format='DD-MM-YYYY HH24:MI:SS';

Session altered.
SQL> select sysdate from dual;

SYSDATE
-------------------
27-04-2022 14:33:03

SQL> select to_char(sysdate,'FMDay, DDth Month YYYY') from dual;

TO_CHAR(SYSDATE,'FMDAY,DDTHMONTHYYYY')
-----------------------------------------
Wednesday, 27TH April 2022

SQL> select systimestamp from dual;

SYSTIMESTAMP
-----------------------------------------
27-APR-22 02.33.10.675396 PM +02:00

SQL> alter session set nls_timestamp_tz_format='DD-MM-YYYY HH24:MI:SSXFF';

Session altered.

SQL> select systimestamp from dual;

SYSTIMESTAMP
------------------------------------------
27-04-2022 14:33:18.033306

SQL> select to_char(systimestamp,'FMDay, DDth Month YYYY HH24:MI:SSXFF TZR') from dual;

TO_CHAR(SYSTIMESTAMP,'FMDAY,DDTHMONTHYYYYHH24:MI:SSXFFTZR')
------------------------------------------
Wednesday, 27TH April 2022 14:33:22.260310 +02:00
dbms_utility.get_time
A possibility to measure very exact times (1/100 of a second) in plsql.
SQL>declare
2   time number;
3 begin
4   time:=dbms_utility.get_time;
5   dbms_session.sleep(3);
6   dbms_output.put_line('Elapsed in sec: '||to_char((dbms_utility.get_time - time)/100));
7 end;
8 /
Elapsed in sec: 3.04
PL/SQL procedure successfully completed.
SQL>
Be aware that the numbers returned by get_time are often negative integers, like -1618843773.
We can also use this to measure the time between several sql*plus calls by storing the first time in a sql*plus variable. So it doesn’t need to be a single large plsql block.
SQL> var stime number;
SQL> exec :stime := dbms_utility.get_time;

PL/SQL procedure successfully completed.

SQL> exec dbms_session.sleep(3);

PL/SQL procedure successfully completed.

SQL> select * from dual;

D
-
X

SQL> exec dbms_output.put_line('Elapsed in sec: '||to_char((dbms_utility.get_time - :stime)/100));
Elapsed in sec: 18.62

PL/SQL procedure successfully completed.

SQL>
Serveroutput needs to be switched on to see the result of dbms_output.
Recommendations
For crude but easy performance time measurements set time on and set timing on are solid.
For exact and comparable measurements on the database use dbms_utility.get_time.
To show date and time in scripts sometimes _DATE is a little easier to use than sysdate.
To add the full runtime of a script to the end of a spooled logfile timing start+stop can be used.
A colleaque made me aware of the following misbehaviour of Oracles optimizer. Shoutout to Christine S. who discovered that problem.
demo
create table a
as select 1 x from dual;

create table b
as select 1 x, 1 y from dual union all
   select 1 x ,2 y from dual;

select a.x, c.y
from  a,
     lateral (select b.x, max (b.y) y from b where b.x = a.x) c
where a.x = c.x;
result
         X          Y
---------- ----------
         1          2
At first glance this looks like what we intended to see. However a closer inspection of the code reveals that select b.x, max (b.y) y from b is not valid syntax. We do get an error message, when running it directly.
ORA-00937: not a single-group group function
We also get the same error message when we use the select with the lateral keyword to drive a materialized view.
create materialized view mv
as
select a.x, c.y
from a,
     lateral (select b.x, max (b.y) y from b where b.x = a.x) c
where a.x = c.x;
ERROR at line 5:
ORA-00937: not a single-group group function
The ORA-937 error message is correct and should be displayed.
That we get a result in the first case, is an error!
reason
Oracle transforms the lateral join into a decorrelated lateral join. During this transformation the syntax error disappears. We see this when checking the outline section of the execution plan (see below). This transformation is different when used in a materialized view.
select *
from dbms_xplan.display_cursor(sql_id=>'2c1nchvqtjt6s', format=>'+outline');
The name of the view VW_DCL_xxx indicates that it was used for a decorrelated lateral operation. For a normal lateral operation the name of the view woud be VW_LAT_xxx.
Since 12c (or maybe a little earlier than that) there were some optimizer enhancements to lateral joins, called decorrelation. In essence it means a lateral join, which can be seen as a kind of correlated subquery, is rewritten into a uncorrelated subquery under certain specific circumstances.
I believe this rewrite is almost always wrong. If the developer on purpose decides to use the lateral keyword (same goes for cross apply and outer apply) the optimizer should not try to correct this.
Other authors have written about problems with decorrelation before. See
The case demonstrated here is just another example where decorrelation has gone wrong. An optimizer hint should not change the result of a query, and even more so should not change whether the query is formulated correctly or not. There are exceptions to this rule, where the intention of the hint is to change the outcome, for example ignore_row_on_dupkey_index or fresh_mv. But the (undocumented) DECORRELATE/NO_DECORRELATE hints are no such cases.
workaround
There are two ways to disable the decorrelation and get the expected ora- error message.
a) use the NO_DECORRELATE hint.
SQL> select /*+ no_decorrelate(@"SEL$2") */
  2   a.x, c.y
  3  from  a,
  4       lateral (select b.x, max (b.y) y from b where b.x = a.x) c
  5  where a.x = c.x;
     lateral (select b.x, max (b.y) y from b where b.x = a.x) c
                     *
ERROR at line 4:
ORA-00937: not a single-group group function
b) switch the decorrelation feature off using the hidden (underscore) parameter _optimizer_ansi_join_lateral_enhance
SQL> alter session set "_optimizer_ansi_join_lateral_enhance"=false;

Session altered.

SQL> select a.x, c.y
  2  from  a,
  3       lateral (select b.x, max (b.y) y from b where b.x = a.x) c
  4  where a.x = c.x;
     lateral (select b.x, max (b.y) y from b where b.x = a.x) c
                     *
ERROR at line 3:
ORA-00937: not a single-group group function
conclusion
Although LATERAL joins are a nifty feature, always be aware that such features often come with bugs.
To gather statistics for a schema or a table there is the dbms_stats package. Either we call it manually or the automatic statistic gathering (scheduled) job is used.
We can provide many settings for the statistic gathering job as a parameter during the gather call. For parameters that we do not explicitly set, preferences are used. Either on a global or on individual table level.
Since there are many preferences this article has some SQL statements that help to check how the current dbms_stats preferences are.
Script to show the global preferences. Note that the parameter autostats_target can not be set on table level, because it directly influences the area of work for the auto stats gathering job.
set linesize 250
set pagesize 100
column preference_name format a30
column preference_value format a50

-- global preferences
with preflist (preference_name,global_only)
as (select 'APPROXIMATE_NDV_ALGORITHM',0 from dual union all
    select 'AUTO_STAT_EXTENSIONS'     ,0 from dual union all
    select 'AUTO_TASK_STATUS'         ,0 from dual union all
    select 'AUTO_TASK_MAX_RUN_TIME'   ,0 from dual union all
    select 'AUTO_TASK_INTERVAL'       ,0 from dual union all
    select 'AUTOSTATS_TARGET'         ,1 from dual union all
    select 'CASCADE'                  ,0 from dual union all
    select 'CONCURRENT'               ,0 from dual union all
    select 'DEGREE'                   ,0 from dual union all
    select 'ESTIMATE_PERCENT'         ,0 from dual union all
    select 'GLOBAL_TEMP_TABLE_STATS'  ,0 from dual union all
    select 'GRANULARITY'              ,0 from dual union all
    select 'INCREMENTAL'              ,0 from dual union all
    select 'INCREMENTAL_STALENESS'    ,0 from dual union all
    select 'INCREMENTAL_LEVEL'        ,0 from dual union all
    select 'METHOD_OPT'               ,0 from dual union all
    select 'NO_INVALIDATE'            ,0 from dual union all
    select 'OPTIONS'                  ,0 from dual union all
    select 'PREFERENCE_OVERRIDES_PARAMETER',0 from dual union all
    select 'PUBLISH'                  ,0 from dual union all
    select 'STALE_PERCENT'            ,0 from dual union all
    select 'STAT_CATEGORY'            ,0 from dual union all
    select 'TABLE_CACHED_BLOCKS'      ,0 from dual union all
    select 'WAIT_TIME_TO_UPDATE_STATS',0 from dual )
select preference_name,
       sys.dbms_stats.get_prefs(preference_name) as preference_value,
       global_only
from preflist;
And the result might look like this
PREFERENCE_NAME
PREFERENCE_VALUE
APPROXIMATE_NDV_ALGORITHM
HYPERLOGLOG
AUTO_STAT_EXTENSIONS
OFF
AUTO_TASK_STATUS
OFF
AUTO_TASK_MAX_RUN_TIME
3600
AUTO_TASK_INTERVAL
900
AUTOSTATS_TARGET
ORACLE
CASCADE
DBMS_STATS.AUTO_CASCADE
CONCURRENT
OFF
DEGREE
NULL
ESTIMATE_PERCENT
DBMS_STATS.AUTO_SAMPLE_SIZE
GLOBAL_TEMP_TABLE_STATS
SESSION
GRANULARITY
AUTO
INCREMENTAL
FALSE
INCREMENTAL_STALENESS
NULL
INCREMENTAL_LEVEL
PARTITION
METHOD_OPT
FOR ALL COLUMNS SIZE AUTO
NO_INVALIDATE
DBMS_STATS.AUTO_INVALIDATE
OPTIONS
GATHER
PREFERENCE_OVERRIDES_PARAMETER
FALSE
PUBLISH
TRUE
STALE_PERCENT
10
STAT_CATEGORY
OBJECT_STATS, REALTIME_STATS
TABLE_CACHED_BLOCKS
1
WAIT_TIME_TO_UPDATE_STATS
15
global preferences for dbms_stats
Show table preferences
And here is how to show the preferences for a single (or a few) table(s) and compare them to the global preferences. Add your table names to the list of tables in the tabs subquery.
-- table preferences
with tabs (owner, table_name)
  as (select user , 'MYTABLE1' from dual union all
      select 'STAGE' , 'MYTABLE2' from dual union all
      select 'STAGE' , 'MYTABLE' from dual
      )
, preflist (preference_name, global_only)
as (select 'APPROXIMATE_NDV_ALGORITHM',0 from dual union all
    select 'AUTO_STAT_EXTENSIONS'     ,0 from dual union all
    select 'AUTO_TASK_STATUS'         ,0 from dual union all
    select 'AUTO_TASK_MAX_RUN_TIME'   ,0 from dual union all
    select 'AUTO_TASK_INTERVAL'       ,0 from dual union all
    select 'AUTOSTATS_TARGET'         ,1 from dual union all
    select 'CASCADE'                  ,0 from dual union all
    select 'CONCURRENT'               ,0 from dual union all
    select 'DEGREE'                   ,0 from dual union all
    select 'ESTIMATE_PERCENT'         ,0 from dual union all
    select 'GLOBAL_TEMP_TABLE_STATS'  ,0 from dual union all
    select 'GRANULARITY'              ,0 from dual union all
    select 'INCREMENTAL'              ,0 from dual union all
    select 'INCREMENTAL_STALENESS'    ,0 from dual union all
    select 'INCREMENTAL_LEVEL'        ,0 from dual union all
    select 'METHOD_OPT'               ,0 from dual union all
    select 'NO_INVALIDATE'            ,0 from dual union all
    select 'OPTIONS'                  ,0 from dual union all
    select 'PREFERENCE_OVERRIDES_PARAMETER',0 from dual union all
    select 'PUBLISH'                  ,0 from dual union all
    select 'STALE_PERCENT'            ,0 from dual union all
    select 'STAT_CATEGORY'            ,0 from dual union all
    select 'TABLE_CACHED_BLOCKS'      ,0 from dual union all
    select 'WAIT_TIME_TO_UPDATE_STATS',0 from dual
    )
,tabprefs as (select t.owner, t.table_name, preference_name,
       sys.dbms_stats.get_prefs(preference_name,null,null) as preference_global,
       case when global_only=0
            then sys.dbms_stats.get_prefs(preference_name,t.owner,t.table_name)
       end as preference_table,
       global_only
       from preflist
       cross join tabs t
)
select p.*,
       case when global_only=1 then null
            when preference_global=preference_table then 'FALSE'
             else 'TRUE'
             end as individual_table_pref
from tabprefs p
;
The select gives a comparison between the preferences on global and on table level.
OWNER
TABLE_NAME
PREFERENCE_NAME
PREFERENCE_GLOBAL
PREFERENCE_TABLE
GLOBAL_ONLY
INDIVIDUAL_TABLE_PREF
SVEN
MYTABLE1
APPROXIMATE_NDV_ALGORITHM
HYPERLOGLOG
HYPERLOGLOG
0
FALSE
SVEN
MYTABLE1
AUTO_STAT_EXTENSIONS
OFF
OFF
0
FALSE
SVEN
MYTABLE1
AUTO_TASK_STATUS
OFF
OFF
0
FALSE
SVEN
MYTABLE1
AUTO_TASK_MAX_RUN_TIME
3600
3600
0
FALSE
SVEN
MYTABLE1
AUTO_TASK_INTERVAL
900
900
0
FALSE
SVEN
MYTABLE1
AUTOSTATS_TARGET
ORACLE
1
SVEN
MYTABLE1
CASCADE
DBMS_STATS.AUTO_CASCADE
DBMS_STATS.AUTO_CASCADE
0
FALSE
SVEN
MYTABLE1
CONCURRENT
OFF
OFF
0
FALSE
SVEN
MYTABLE1
DEGREE
NULL
NULL
0
FALSE
SVEN
MYTABLE1
ESTIMATE_PERCENT
DBMS_STATS.AUTO_SAMPLE_SIZE
DBMS_STATS.AUTO_SAMPLE_SIZE
0
FALSE
SVEN
MYTABLE1
GLOBAL_TEMP_TABLE_STATS
SESSION
SESSION
0
FALSE
SVEN
MYTABLE1
GRANULARITY
AUTO
AUTO
0
FALSE
SVEN
MYTABLE1
INCREMENTAL
FALSE
TRUE
0
TRUE
SVEN
MYTABLE1
INCREMENTAL_STALENESS
NULL
NULL
0
FALSE
SVEN
MYTABLE1
INCREMENTAL_LEVEL
PARTITION
PARTITION
0
FALSE
SVEN
MYTABLE1
METHOD_OPT
FOR ALL COLUMNS SIZE AUTO
FOR ALL COLUMNS SIZE AUTO
0
FALSE
SVEN
MYTABLE1
NO_INVALIDATE
DBMS_STATS.AUTO_INVALIDATE
DBMS_STATS.AUTO_INVALIDATE
0
FALSE
SVEN
MYTABLE1
OPTIONS
GATHER
GATHER
0
FALSE
SVEN
MYTABLE1
PREFERENCE_OVERRIDES_PARAMETER
FALSE
FALSE
0
FALSE
SVEN
MYTABLE1
PUBLISH
TRUE
TRUE
0
FALSE
SVEN
MYTABLE1
STALE_PERCENT
10
10
0
FALSE
SVEN
MYTABLE1
STAT_CATEGORY
OBJECT_STATS, REALTIME_STATS
OBJECT_STATS, REALTIME_STATS
0
FALSE
SVEN
MYTABLE1
TABLE_CACHED_BLOCKS
1
1
0
FALSE
SVEN
MYTABLE1
WAIT_TIME_TO_UPDATE_STATS
15
15
0
FALSE
table preferences for dbms_stats
The last column INDIVIDUAL_TABLE_PREF indicates whether the global setting was changed on table level or not. But take it with a grain of salt. Some preferences might have additional restrictions, like the INCREMENTAL_LEVEL can be set to PARTITION only if the table is actually partitioned. Otherwise the default for the table will be TABLE, even if the global setting differs.
Show all changed preferences on table level for a schema
And finally here is a statement that goes through all the tables in one (or several schemas) and finds settings where the global and the table preference differs. For each preference value combination it lists the number of table and the table names.
In the tabs subquery list all the schemas you want to be checked.
-- All tables with a non default setting
with tabs
  as (select owner, table_name, partitioned
      from dba_tables
      where owner in (user,'STAGE')
      )
,preflist (preference_name, global_only)
as (select 'APPROXIMATE_NDV_ALGORITHM',0 from dual union all
    select 'AUTO_STAT_EXTENSIONS'     ,0 from dual union all
    select 'AUTO_TASK_STATUS'         ,0 from dual union all
    select 'AUTO_TASK_MAX_RUN_TIME'   ,0 from dual union all
    select 'AUTO_TASK_INTERVAL'       ,0 from dual union all
    select 'AUTOSTATS_TARGET'         ,1 from dual union all
    select 'CASCADE'                  ,0 from dual union all
    select 'CONCURRENT'               ,0 from dual union all
    select 'DEGREE'                   ,0 from dual union all
    select 'ESTIMATE_PERCENT'         ,0 from dual union all
    select 'GLOBAL_TEMP_TABLE_STATS'  ,0 from dual union all
    select 'GRANULARITY'              ,0 from dual union all
    select 'INCREMENTAL'              ,0 from dual union all
    select 'INCREMENTAL_STALENESS'    ,0 from dual union all
    select 'INCREMENTAL_LEVEL'        ,0 from dual union all
    select 'METHOD_OPT'               ,0 from dual union all
    select 'NO_INVALIDATE'            ,0 from dual union all
    select 'OPTIONS'                  ,0 from dual union all
    select 'PREFERENCE_OVERRIDES_PARAMETER',0 from dual union all
    select 'PUBLISH'                  ,0 from dual union all
    select 'STALE_PERCENT'            ,0 from dual union all
    select 'STAT_CATEGORY'            ,0 from dual union all
    select 'TABLE_CACHED_BLOCKS'      ,0 from dual union all
    select 'WAIT_TIME_TO_UPDATE_STATS',0 from dual
    )
,tabprefs as (select t.owner, t.table_name, t.partitioned,
       preference_name, global_only,
       sys.dbms_stats.get_prefs(preference_name,null,null) as preference_global,
       case when global_only=0 then sys.dbms_stats.get_prefs(preference_name,t.owner,t.table_name) end as preference_table
       from preflist
       cross join tabs t
)
select preference_name, preference_global, preference_table, listagg(owner||'.'||table_name,',' on overflow truncate without count) within group (order by owner, table_name) tables, count(*) table#
from tabprefs p
where global_only=0
and preference_global!=preference_table
-- Special case: incremental_level can only be TABLE for non partitioned tables, even if default is different.
and not (preference_name='INCREMENTAL_LEVEL' and partitioned='NO' and preference_table='TABLE' and preference_global='PARTITION')
group by preference_name, preference_global, preference_table
order by preference_name, preference_global, preference_table;
Note that there is some special consideration for the previously mentioned INCREMENTAL_LEVEL preference.
So in this case there were 203 tables (not all names shown) where the INCREMENTAL preference on table level was set to TRUE compared to the global setting of FALSE. This indicates that the global preference was changed, after most of the tables had been created.
Conclusion
It is hard to remember all the different settings that do influence stats gathering. Especially in cases where we wonder, why the settings did not seem to work as expected, it helps to check all the preferences on each level.
A little while ago during an ODA X7-2S upgrade from 19.6 to 19.9 the following error was encountered.
SUCCESS: 2021-06-04 10:02:05: ...EFI device backup saved as '/opt/odabr/out/hbi/efi.img'
INFO: 2021-06-04 10:02:05: ...step3 - checking EFI device backup
ERROR: 2021-06-04 10:02:05: Error running fsck over /opt/odabr/out/hbi/efi.img
ERROR: 2021-06-04 10:02:05: Command: 'fsck -a /opt/odabr/out/hbi/efi.img' failed as fsck from util-linux 2.23.2 fsck.fat 3.0.20 (12 Jun 2013) 0x25: Dirty bit is set. Fs was not properly unmounted and some data may be corrupt.  Automatically removing dirty bit. Performing changes. /opt/odabr/out/hbi/efi.img: 23 files, 1245/63965 clusters
INFO: 2021-06-04 10:02:05: Mounting EFI back
ERROR: 2021-06-04 10:02:06: Backup not completed, exiting...
This seems to be a known issue for Bare Metal ODAs. But the way to solve the problem is poorly documented.
The mos notes
The Oracle ODABR support document mentions the problem twice and gives slightly different solutions.
Check the “ODABR – Use Case” and the “known issues section”.
The document also mentions Internal Bug 31435951 ODABR FAILS IN FSCK WITH “DIRTY BIT IS SET”.
From the public ODABR document
This is not an ODABR issue. ODABR is signalling a fsck error because your (in this case) efi partition is not in expected status… To fix this:
unmount efi fsck.vfat -v -a -w <efidevice> mount efi
Unfortunatly the workaround is a bit vague and hard to understand. The efi partition is mounted as /boot/efi . The “efi device” is not the same as the mount point but can be gathered from that.
Here are the exact commands that helped me to solve the issue.
The solution
First check your filesystem (the output was taken after we repaired the issue) – your mileage may vary.
Then we did the steps as described in the documentation:
[root@ODA01 odabr]# umount /boot/efi[root@ODA01 odabr]# fsck.vfat -v -a -w /dev/sda1
fsck.fat 3.0.20 (12 Jun 2013)
fsck.fat 3.0.20 (12 Jun 2013)
Checking we can access the last sector of the filesystem
0x25: Dirty bit is set. Fs was not properly unmounted and some data may be corrupt.
Automatically removing dirty bit.
Boot sector contents:
System ID "mkdosfs"
Media byte 0xf8 (hard disk)
512 bytes per logical sector
8192 bytes per cluster
16 reserved sectors
First FAT starts at byte 8192 (sector 16)
2 FATs, 16 bit entries
131072 bytes per FAT (= 256 sectors)
Root directory starts at byte 270336 (sector 528)
512 root directory entries
Data area starts at byte 286720 (sector 560)
63965 data clusters (524001280 bytes)
63 sectors/track, 255 heads
0 hidden sectors
1024000 sectors total
Reclaiming unconnected clusters.
Performing changes.
/dev/sda1: 23 files, 1245/63965 clusters
[root@ODA01 odabr]# mount /boot/efi
After this, we could sucessfully create an ODABR snapshot
[root@ODA01 odabr]# ./odabr backup -snap -osize 50 -usize 80
INFO: 2021-06-04 12:14:49: Please check the logfile '/opt/odabr/out/log/odabr_87615.log' for more details
│▒▒▒▒▒▒▒▒▒▒▒▒▒▒▒▒▒▒▒▒▒▒▒▒▒▒▒▒▒▒▒▒▒▒▒▒▒▒▒▒▒▒▒▒▒▒▒▒▒▒▒▒▒▒▒▒│
odabr - ODA node Backup Restore - Version: 2.0.1-62
Copyright Oracle, Inc. 2013, 2020
--------------------------------------------------------
Author: Ruggero Citton <ruggero.citton@oracle.com>
RAC Pack, Cloud Innovation and Solution Engineering Team
│▒▒▒▒▒▒▒▒▒▒▒▒▒▒▒▒▒▒▒▒▒▒▒▒▒▒▒▒▒▒▒▒▒▒▒▒▒▒▒▒▒▒▒▒▒▒▒▒▒▒▒▒▒▒▒▒│
INFO: 2021-06-04 12:14:49: Checking superuser
INFO: 2021-06-04 12:14:49: Checking Bare Metal
INFO: 2021-06-04 12:14:49: Removing existing LVM snapshots
WARNING: 2021-06-04 12:14:49: LVM snapshot for 'opt' does not exist
WARNING: 2021-06-04 12:14:49: LVM snapshot for 'u01' does not exist
WARNING: 2021-06-04 12:14:49: LVM snapshot for 'root' does not exist
INFO: 2021-06-04 12:14:49: Checking LVM size
INFO: 2021-06-04 12:14:49: Boot device backup
INFO: 2021-06-04 12:14:49: Getting EFI device
INFO: 2021-06-04 12:14:49: ...step1 - unmounting EFI
INFO: 2021-06-04 12:14:50: ...step2 - making efi device backup
SUCCESS: 2021-06-04 12:14:54: ...EFI device backup saved as '/opt/odabr/out/hbi/efi.img'INFO: 2021-06-04 12:14:54: ...step3 - checking EFI device backup
INFO: 2021-06-04 12:14:54: Getting boot device
INFO: 2021-06-04 12:14:54: ...step1 - making boot device backup using tar
SUCCESS: 2021-06-04 12:15:05: ...boot content saved as '/opt/odabr/out/hbi/boot.tar.gz'
INFO: 2021-06-04 12:15:05: ...step2 - unmounting boot
INFO: 2021-06-04 12:15:05: ...step3 - making boot device backup using dd
SUCCESS: 2021-06-04 12:15:10: ...boot device backup saved as '/opt/odabr/out/hbi/boot.img'
INFO: 2021-06-04 12:15:10: ...step4 - mounting boot
INFO: 2021-06-04 12:15:10: ...step5 - mounting EFI
INFO: 2021-06-04 12:15:11: ...step6 - checking boot device backup
INFO: 2021-06-04 12:15:12: OCR backup
INFO: 2021-06-04 12:15:13: ...ocr backup saved as '/opt/odabr/out/hbi/ocrbackup_87615.bck'
INFO: 2021-06-04 12:15:13: Making LVM snapshot backup
SUCCESS: 2021-06-04 12:15:13: ...snapshot backup for 'opt' created successfully
SUCCESS: 2021-06-04 12:15:15: ...snapshot backup for 'u01' created successfully
SUCCESS: 2021-06-04 12:15:15: ...snapshot backup for 'root' created successfully
SUCCESS: 2021-06-04 12:15:15: LVM snapshots backup done successfully
Side note: We used smaller backup sizes, to circumvent issues with not having enough space for the snapshot, although there was enough space. But this was not connected to the “dirty bit” issue.
I hope this helps others to troubleshoot their ODA.